I have previously covered the AuthaGraph projection 6 years ago, giving a brief explanation as to why it’s overrated and doesn’t deserve the amount of fanfare it received. I feel like I should revisit that and make a more detailed post that tears down on their marketing and how they made that projection solely to sell rather than to make a scientific advancement.
Now I’m by no means a cartographer, but I do have some experience with GIS software such as QGIS, and I did learn how to use it in my college for use in spatial analysis in public health, so I’m dropping my 2 cents in here just so that people who don’t know about GIS and cartography can understand why AuthaGraph is an overhyped projection that’s actually nothing new and severely crippled by the inventor’s unwillingness to publish its equations in a peer-reviewed cartographic journal.
Let’s take a look at their “About AuthaGraph World Map” page. This contains their handwavy explanations of how they construct their map projection along with some other tidbits. To me, the whole thing just screams marketing lingo designed to sell their products, as I’ll explain below.
Debunking the “About AuthaGraph World Map” page
Slide 1: “AuthaGraph World Map”
Antarctica was found in 1820 and the first man reaches the North Pole in 1909. In the 20th century the world tended to be framed by the East-West relations and the North-South problem. Our interest has been mainly on land since it has been our living environment. Meanwhile from the late 20th century the resources and environment problems have spread our interests over the polar regions and oceans such as,
- Sea ice around the North pole representing the global warming,
- Territorial sea claims for marine resources,
- An ozone hole above the South Pole,
- Melting glaciers in Greenland, a cause that may submerge Tuvalu,
- El Nino in the ocean, a cause of an unusual weather that eventually influence to the economy on land.
The AuthaGraphic world map aims to provide a new view point to perceive the world by equally showing these interests spread over the globe.
The east-west and north-south viewpoints are commonly used on regular world maps because it’s convenient to do so. In a normal aspect, the graticule lines show up as familiar lines spanning from north-south and east-west. This makes it easier to figure out the location of a geographic feature on a globe or another map projection. Unless if you’re doing large or regional-scale mapping, there’s no reason why you should change the aspect to a transverse or oblique one.
Tetrahedral projections—the same class of projections that AuthaGraph belongs to—have existed since 1965, with the first one being the Lee tetrahedral conformal projection, so their claim of “providing a new viewpoint” like that is nothing short of a marketing hype.
In fact, there’s an even older projection named the Peirce quincuncial projection invented in 1879, which is a conformal projection that also tessellates just like AuthaGraph and Lee tetrahedral.
Also, it is possible to modify regular cylindrical, pseudocylindrical, or other regular map projections so that they could fit all landmasses, including Antarctica and the Arctic Circle, into the lower-distortion regions, which just so happens to also break those east-west and north-south relations, if that’s what you’re into.
Judging from this line, you can tell that their marketing claim is to show the world’s issues equally, such as the effects of global warming. The thing is, you don’t normally use general world maps for that purpose. If you want to display melting sea ice on the North Pole, glaciers in Greenland, or an ozone hole in Antarctica, you normally use a polar azimuthal projection instead, such as the azimuthal equal-area projection. This class of projections does a better job at displaying the polar regions and minimizing distortions around the poles compared to a regular world map such as Winkel tripel or even AuthaGraph. Territorial waters? Use a cylindrical, conic, or azimuthal projection depending on the latitude and the extent of the region. El Niño? A standard world map like equirectangular (plate carree), Miller, or Gall stereographic projection should do. The latter case uses world maps indeed, but given the extent of the Pacific ocean, a world map would do a better job there. You don’t need to invent an entirely new projection just to address those issues, because existing ones are already up to the task.
And if you really want an equal-area projection, which AuthaGraph claims to be good at (but is actually not equal-area, as I’ll explain later), you could just use existing projections like Mollweide or Equal Earth. This kind of wording really reminds me of the infamous Gall-Peters projection, which is marketed as “the solution to Mercator and Eurocentrism”, when projections like the aforementioned Mollweide and Equal Earth already exist (and do a far better job at minimizing distortions). In fact, it wasn’t even a new projection, as it was first proposed by James Gall in the 19th century, but unfortunately, many people actually took the bait anyway, simply because marketing is so much more powerful than boring, hard facts.
Slide 2: “AuthaGraphic Projection”
An original method for maintaining areas proportions is called “iso-area-mapping.” And an original mapping process by combining different projection methods via intermediate objects is called “multilayer-mapping.” These ideas for mapping aims [sic] to reduce errors during projecting a sphere to a tetrahedron because a simple optical projection from a sphere to a tetrahedron causes huge distortions therefore useless.
Well, this sounds like a handwavy way to “explain” how you minimize areal distortions without giving too much information so that no one can copy your projection, doesn’t it? None of those terms are officially recognized in the cartographic community, and it shows very little about how the globe is actually transformed into a tetrahedron (*cough* no equations? *cough*).
Slide 3: “Comparison/Rectangle or Accuracy”
AuthaGraph map is able to transform an entire sphere to a rectangle as Mercator projection does while it substantially keeps sizes and shapes of continents as Dymaxion map does.
As I’ve said before, this isn’t unique to AuthaGraph. The Lee tetrahedral projection allows you to do exactly the same thing, as it’s also a tetrahedral projection, and the good thing about it is that because it’s a conformal projection, it fully preserves shapes, except at the points of singularity where conformality fails (which is also present in most conformal projections like Mercator, Lambert conformal conic, or even Peirce quincuncial where they either head towards infinity or suddenly change directions). This makes the Lee tetrahedral projection look more appealing while also offsetting its disadvantage of a slightly higher areal distortion compared to AuthaGraph, and unlike most conformal projections, the distortion is far more manageable due to how tetrahedral projections reduce overall distortions far better than many other projection types, at the cost of directionality.
In terms of areal inflation, the Lee tetrahedral is superior compared to other conformal projections such as Mercator, Lambert conformal conic, azimuthal stereographic, Eisenlohr, Lagrange, or even the Peirce quincuncial projection, at least when used as a world map rather than for large-scale maps. Arranging the world in a similar way to the AuthaGraph projection yields even lower distortions on the continents, as it limits the most distorted areas to the oceans, something that I admit is pretty clever in AuthaGraph’s construction.
There’s also the Peirce quincuncial projection which also tessellates just like these tetrahedral projections. And although it has higher areal distortions, it’s still not too bad either. When centered to -20°, it produces a map with a low areal distortion on the continents and centered on the North Pole, similar to a polar azimuthal projection. The only downside is that Antarctica is split into four parts unlike AuthaGraph, which may not be as desirable if you just wanted a map that doesn’t loop but also neatly fills a rectangle.
There’s also this image and quote that’s shown in there:

Mercator projection: There is no perfect resolution in representing a spherical image on a rectangular piece of paper. In its long history Mercator Projection is one of a few prior arts which fits in a rectangle and has been familiar for 440 years since it guided explorers to the new world. However the shortest distance between two points is described as a curve and it can not describe the polar regions properly. When Mercator made his map in the 16th century, Antarctica has not found yet.
- It shows an air route from Tokyo to Brasilia via Houston as if were a big detour. Mercator Projection often omit describing polar regions. Straight lines drawn on a Mercator projection divided colonies n Africa. Colonies in the 16th century were aligned along equator. Width of the map on the equator represents 40000km. It shows Antarctica much larger and longer than it is in reality. Width of the map at latitude 89.98 degrees represents only 1km.
Dymaxion map: Dymaxion map invented by Buckminster Fuller in 1946 properly represents shapes of continents and a confrontation between US and USSR around the Arctic Ocean not between east and west. However it gives a priority to keep the shape of continents. The outlines of oceans are interrupted.
- A shape of Dymaxion map does not fit in rectangular format without gaps and overlaps. The map is hardly able to describe ocean currents.
AuthaGraph: Thus existing maps either contain distortion when tranforming an entire sphere to a rectangle, or when correcting distortions, they are unable to fit the outlines in a rectangle without gaps, so called mechanical vignetting. The proposed world map was developed by multi-layers of projections (mapping) via a tetrahedron. By the method it is able to transform an entire sphere to a rectangle as Mercator projection does while it substantially keeps sizes and sizes of continents as Dymaxion map does.
This is just absolute BS. Let me explain
Mercator projection: Ah yes, the usual strawman that is Mercator. Honestly, I feel like people really should stop bashing the Mercator projection, because it’s never intended to be a general-purpose world map, but rather for navigation. The only reason why map services such as Google Maps or OpenStreetMap uses it (particularly a variant known as the Web Mercator, which isn’t truly conformal unlike the real Mercator), is simply because it’s far more useful for GPS-based navigation, as angles are preserved so you can make turns in the right direction while driving, plus the fact that it preserves shapes means that buildings don’t get squished when you zoom all the way in.
Dymaxion projection: You don’t use the Dymaxion projection for things like great circle paths. It was clearly designed as a projection to minimize areal distortiona on landmasses, and trying to use that for anything else is an inappropriate use of this projection. Again, just stop using the wrong tool for the job, and you’ll be fine. There’s really no need to invent an entirely new projection just for this.
The Mercator projection shows a flight path from Tokyo to Brasilia via Houston as curves, whereas on the AuthaGraph projection it shows up as a straight line.
Wrong. Using Justin Kunimune’s reverse-engineered AuthaGraph lookalike (which is also a compromise tetrahedral projection), the flight path shows up as irregular curves because it lacks the required property to preserve great circle paths. The only projection that can show all great circle paths as straight lines is the gnomonic projection, and that introduces severe distortions and can’t even show a hemisphere. Azimuthal equidistant can be used , but only the great circles that pass through the center of the projection are displayed as straight lines. The way they present the flight path as straight lines is incredibly misleading, and this could be the reason why they’re unwilling to publish their equations, as it would reveal the unpleasant truths of this map projection towards the public once the scientific community dissects this projection.
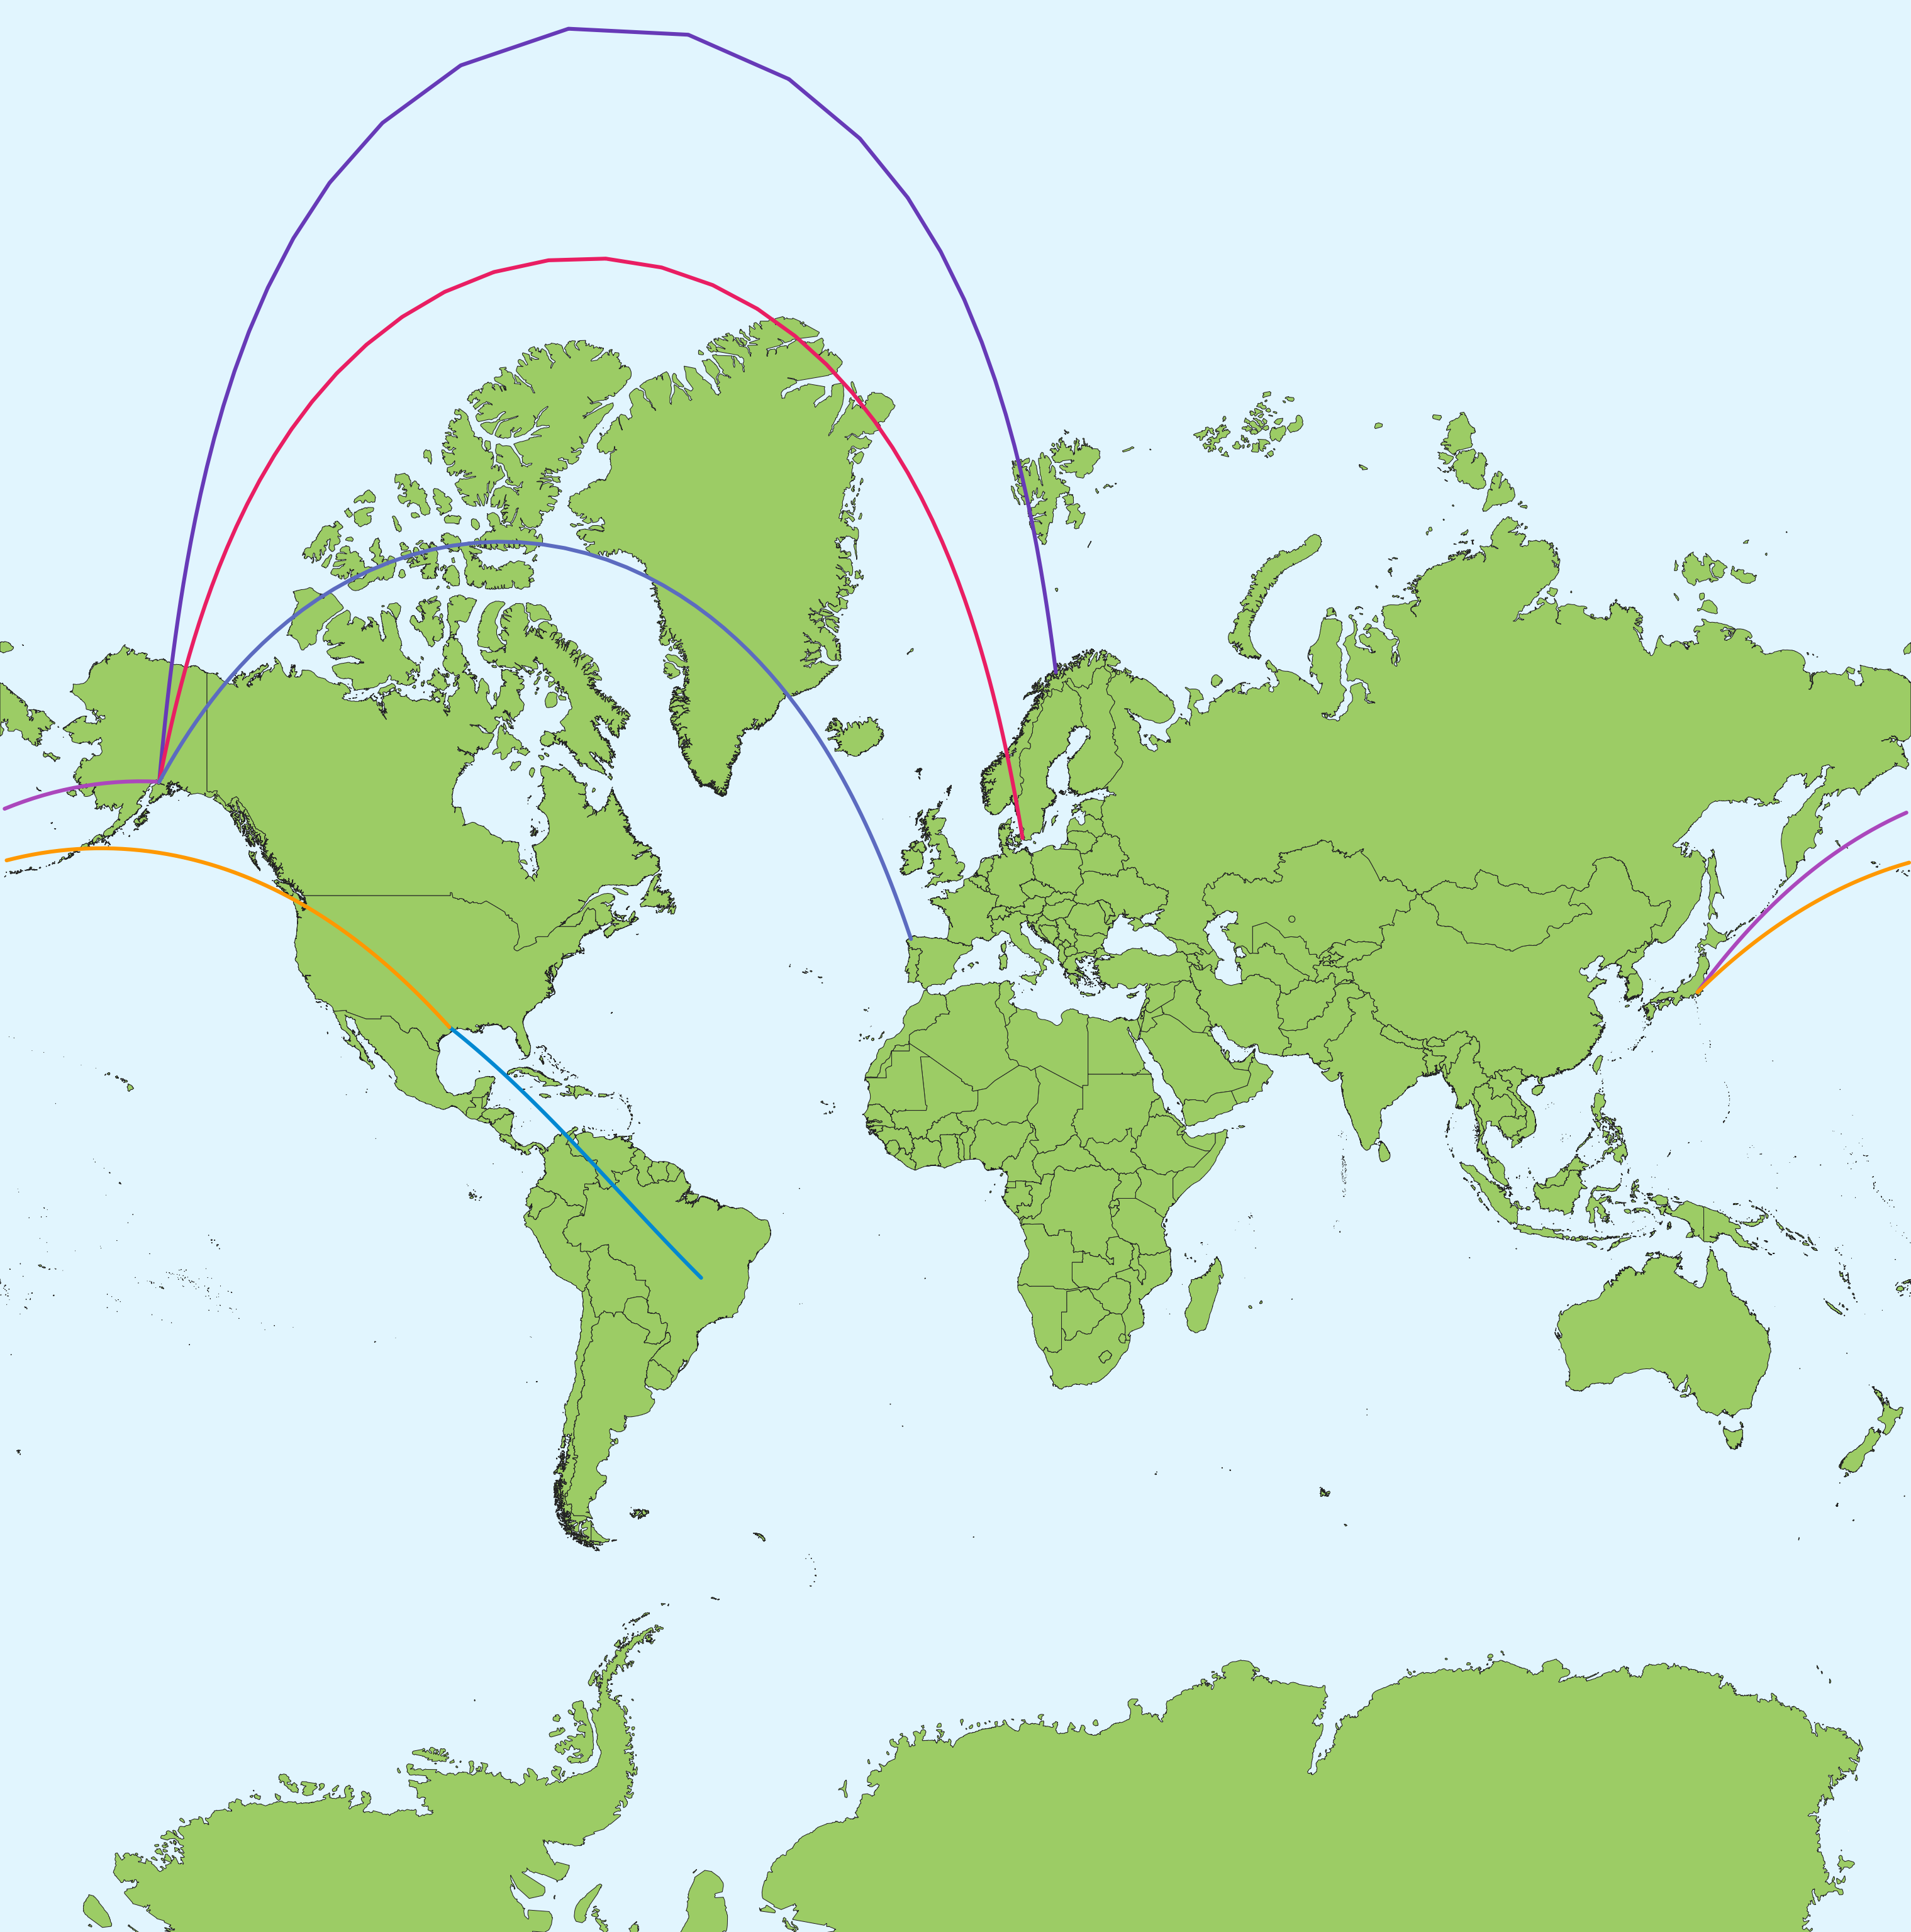
The flight paths in Mercator projection
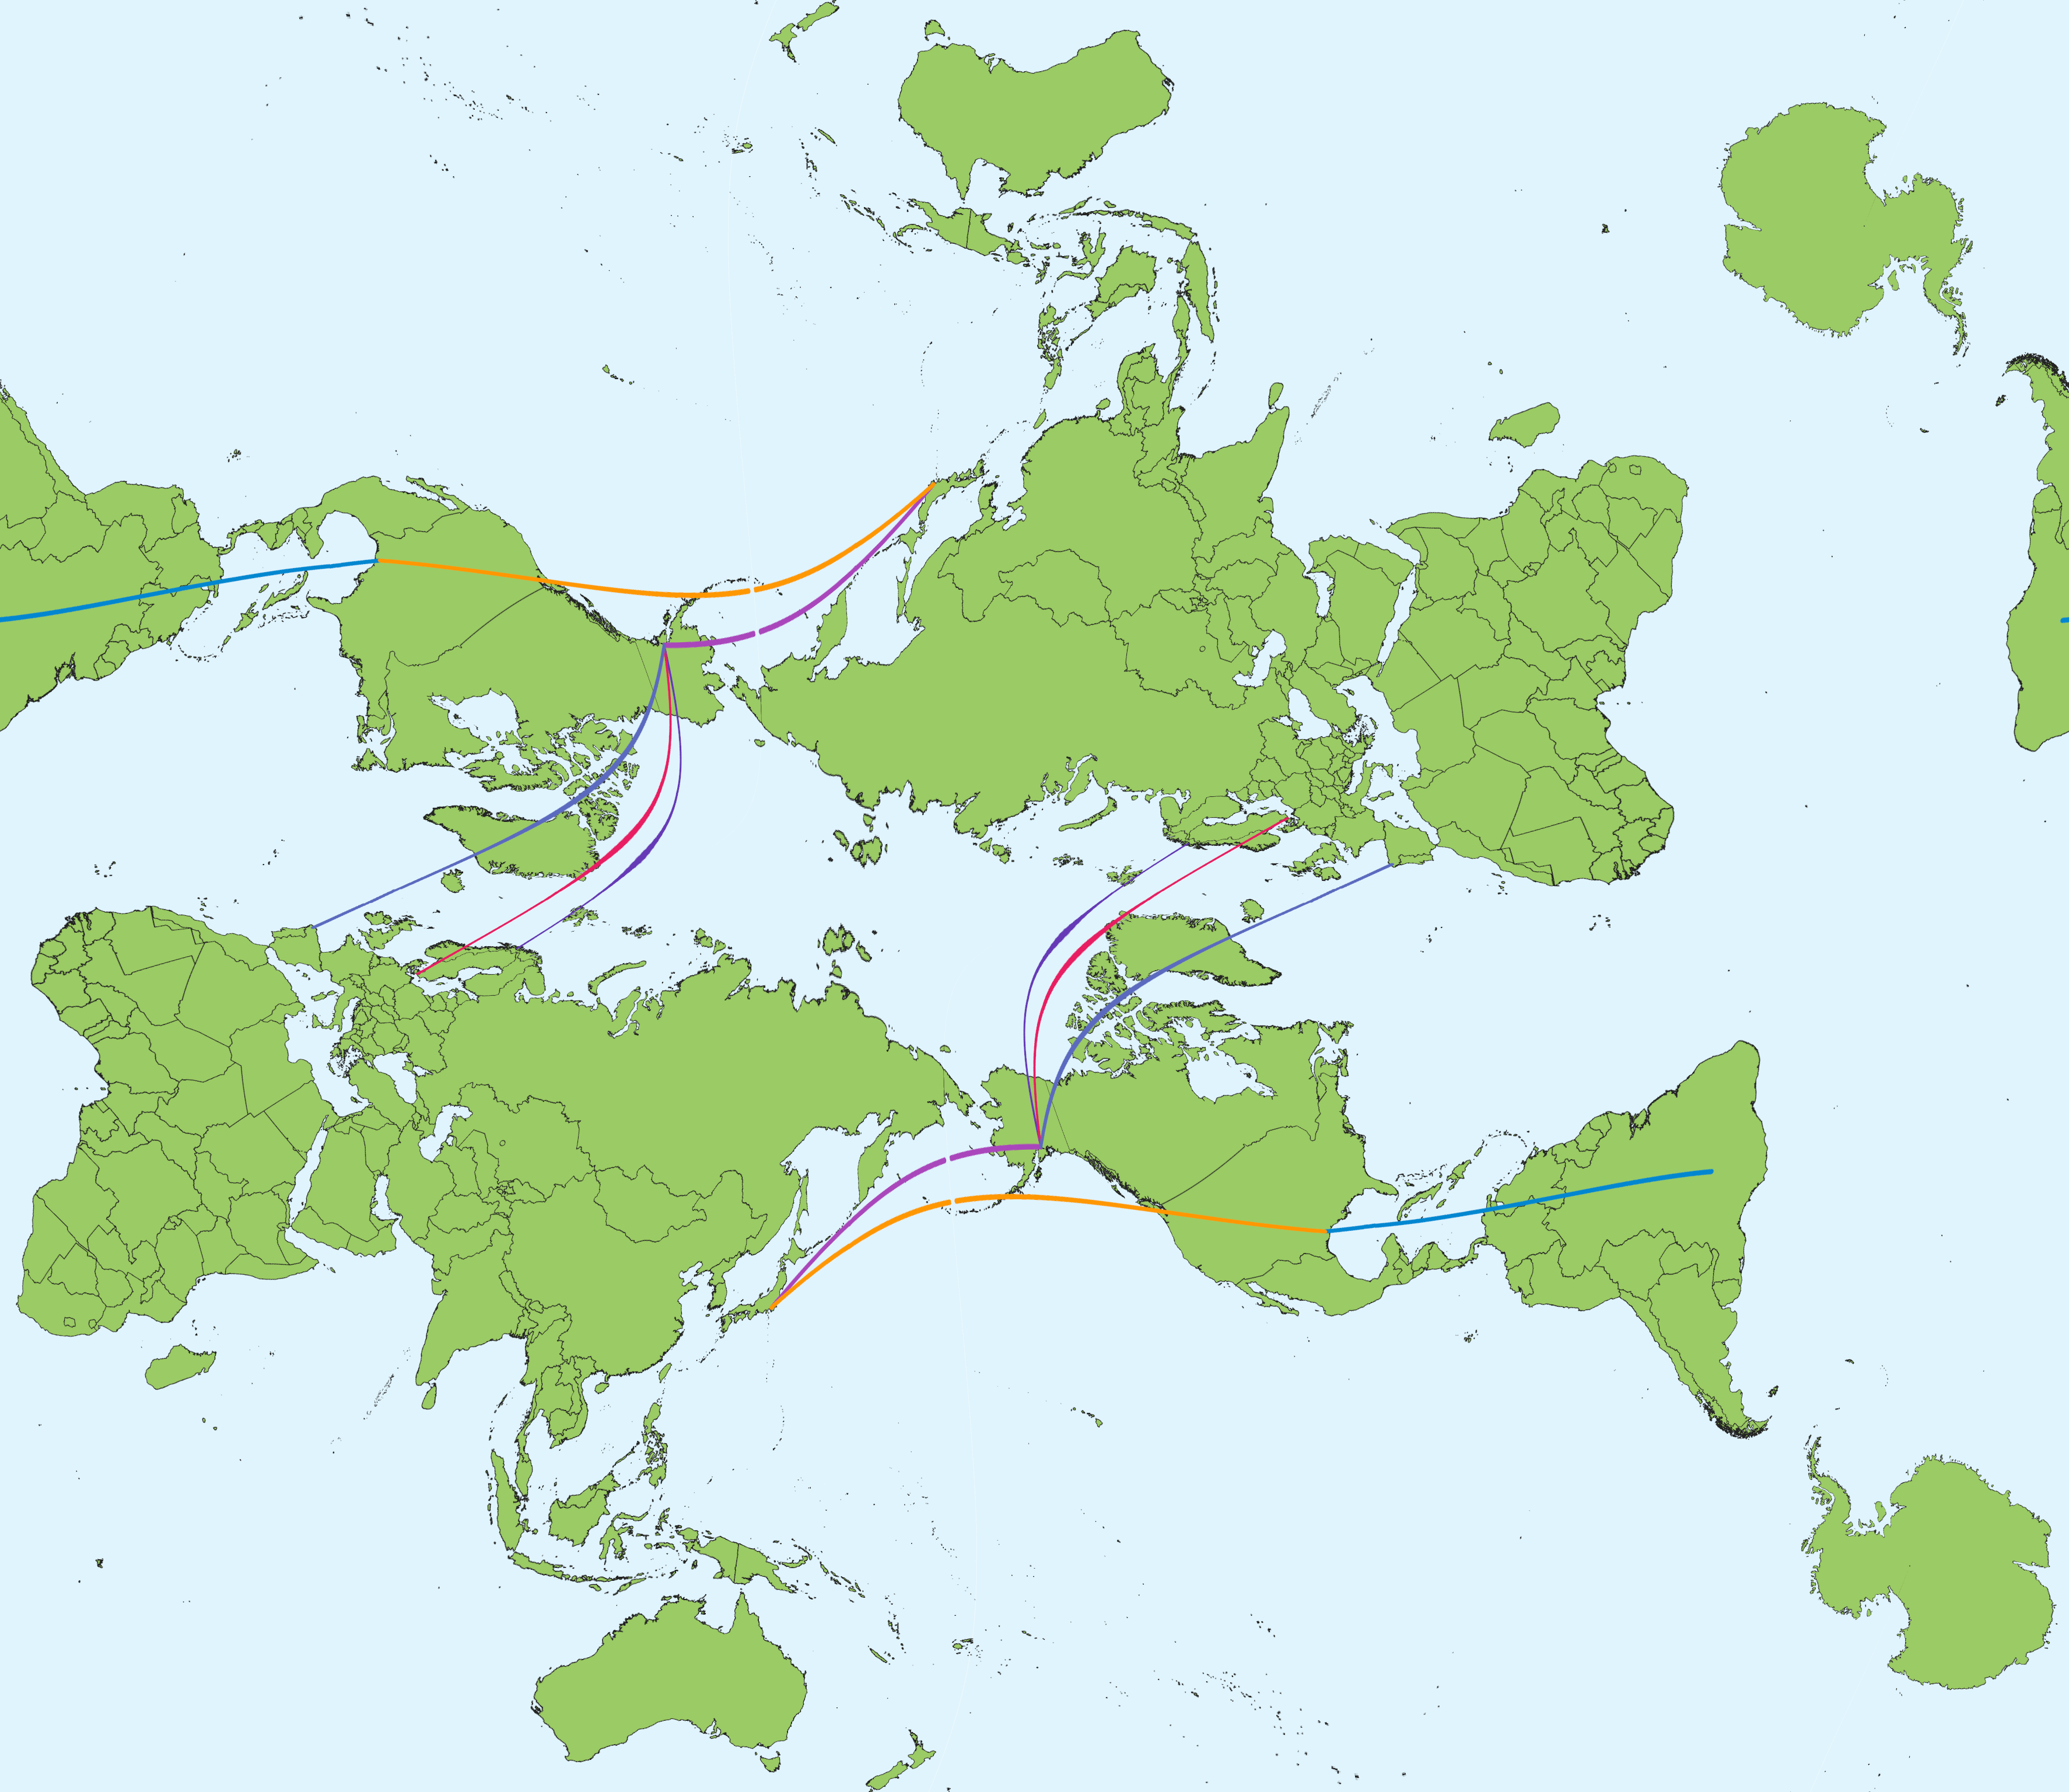
Kunimune's IMAGO projection
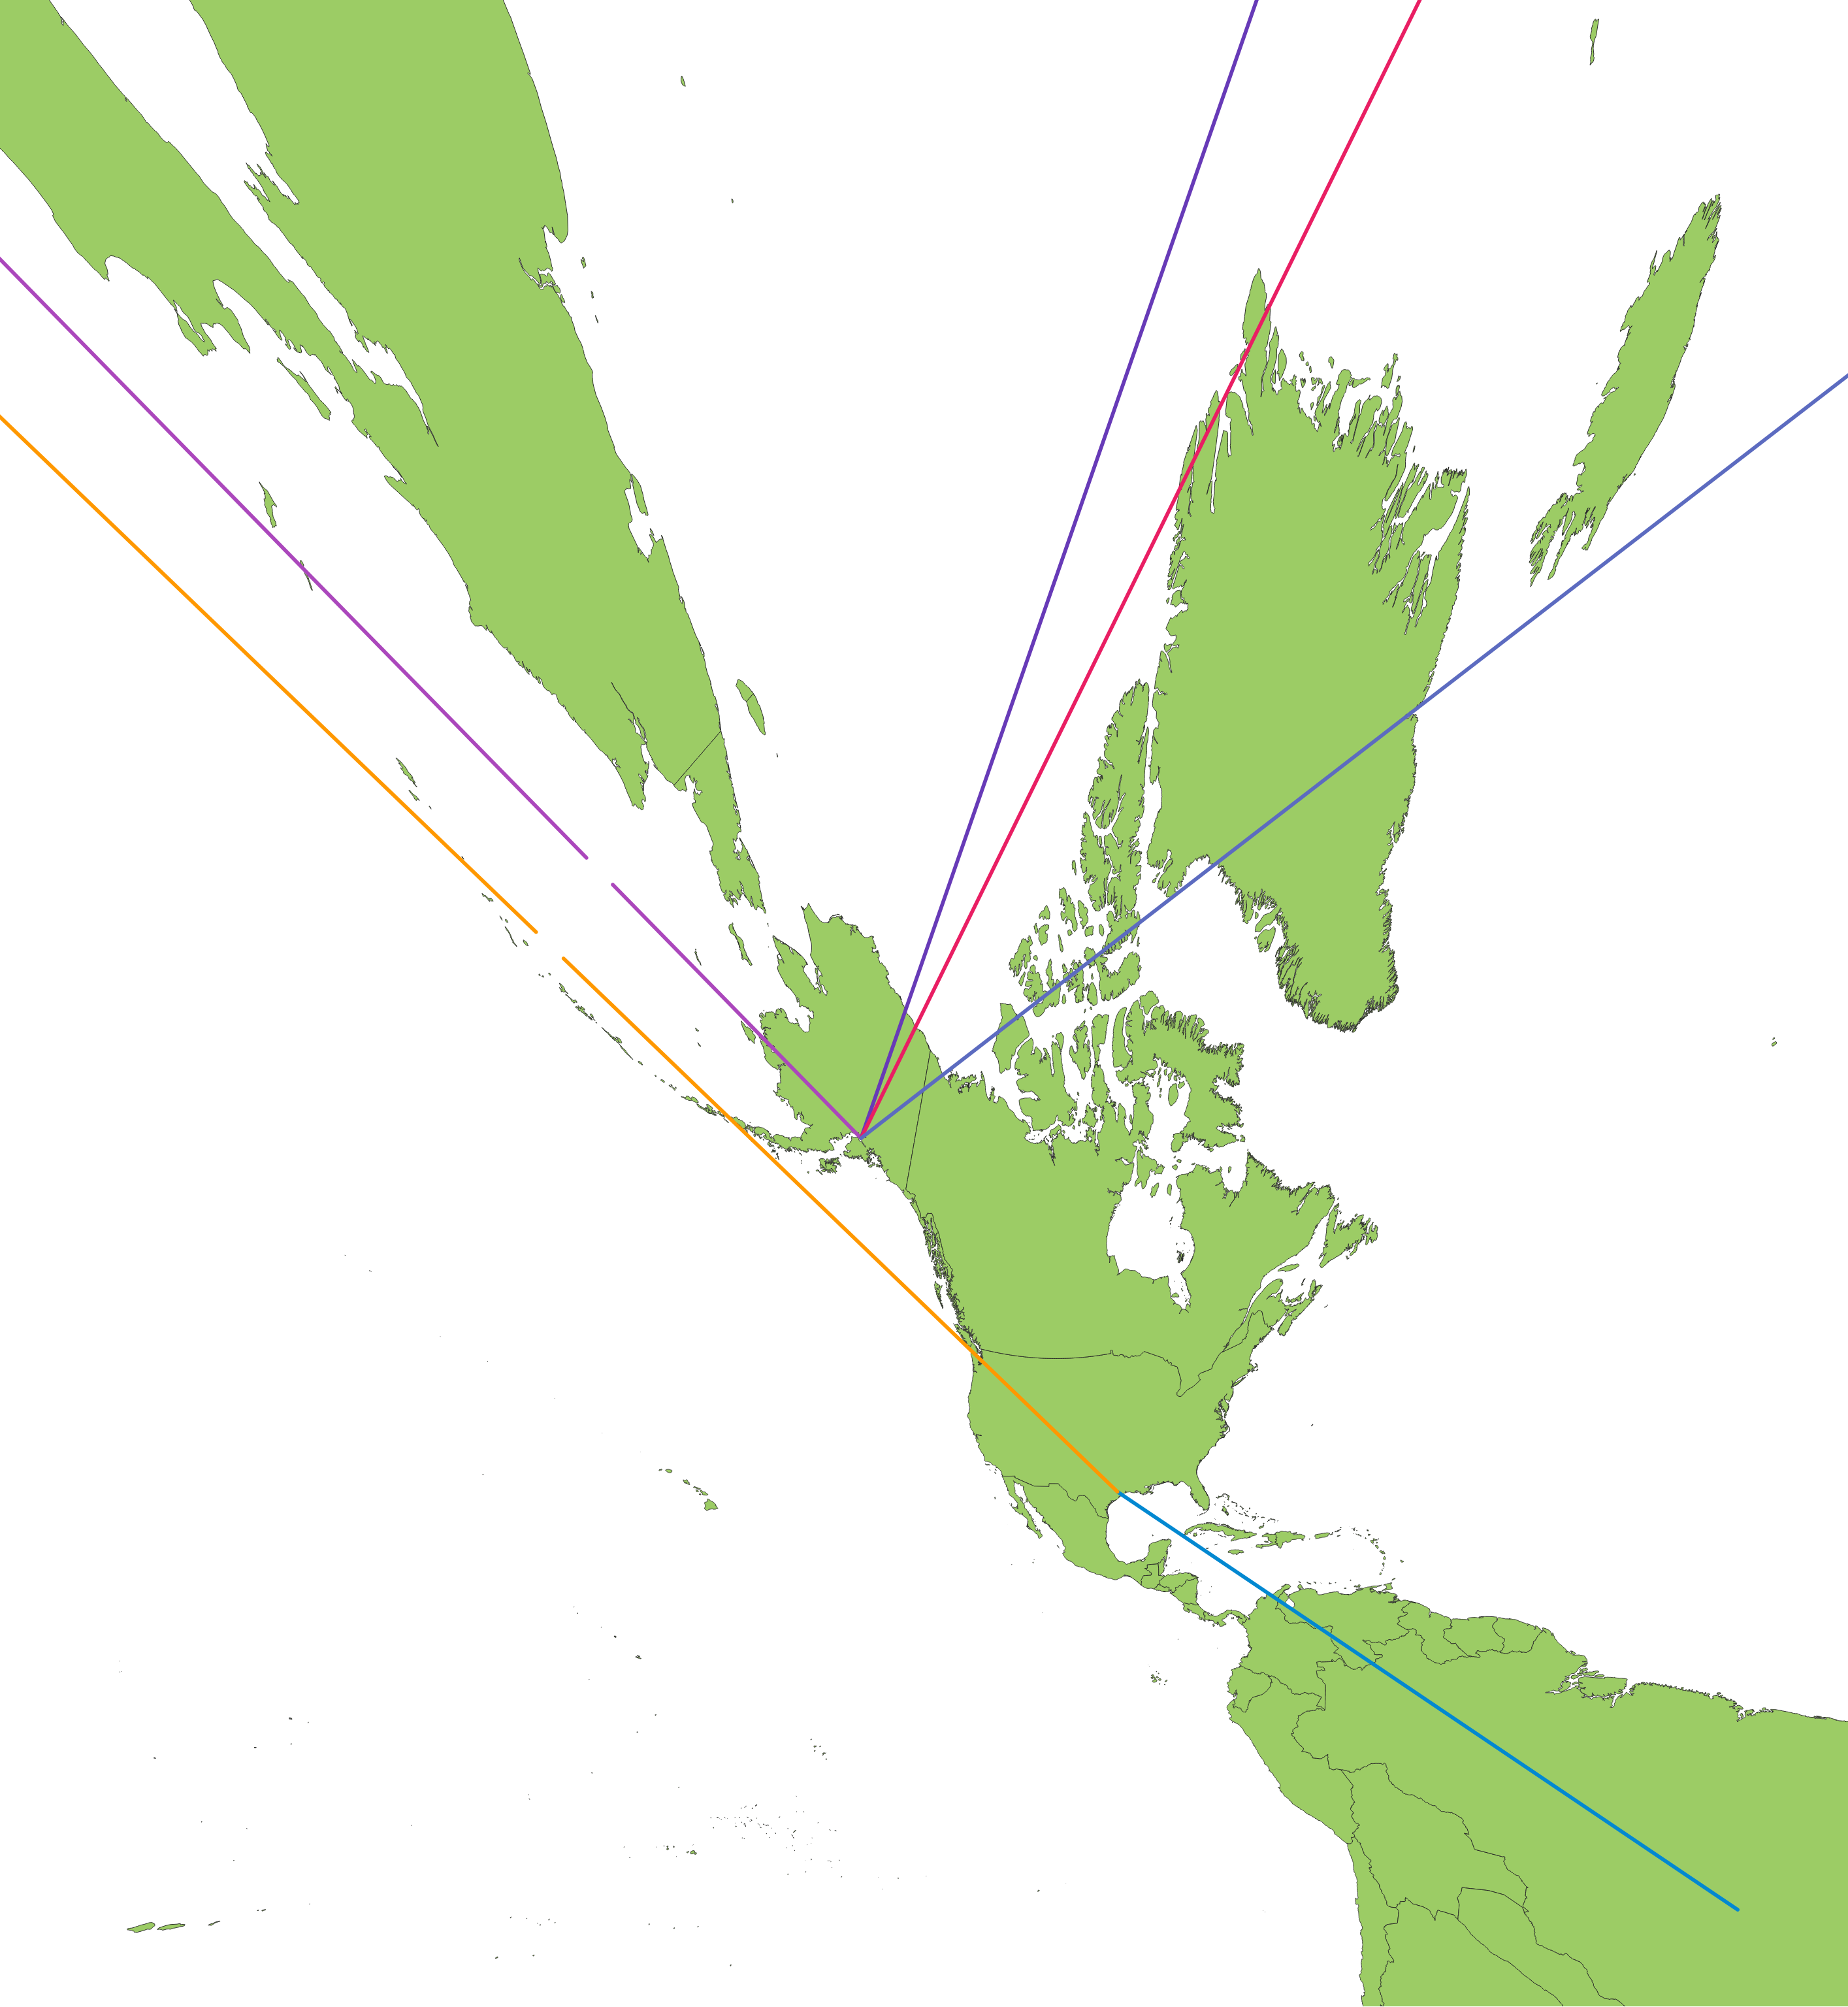
Gnomonic projection
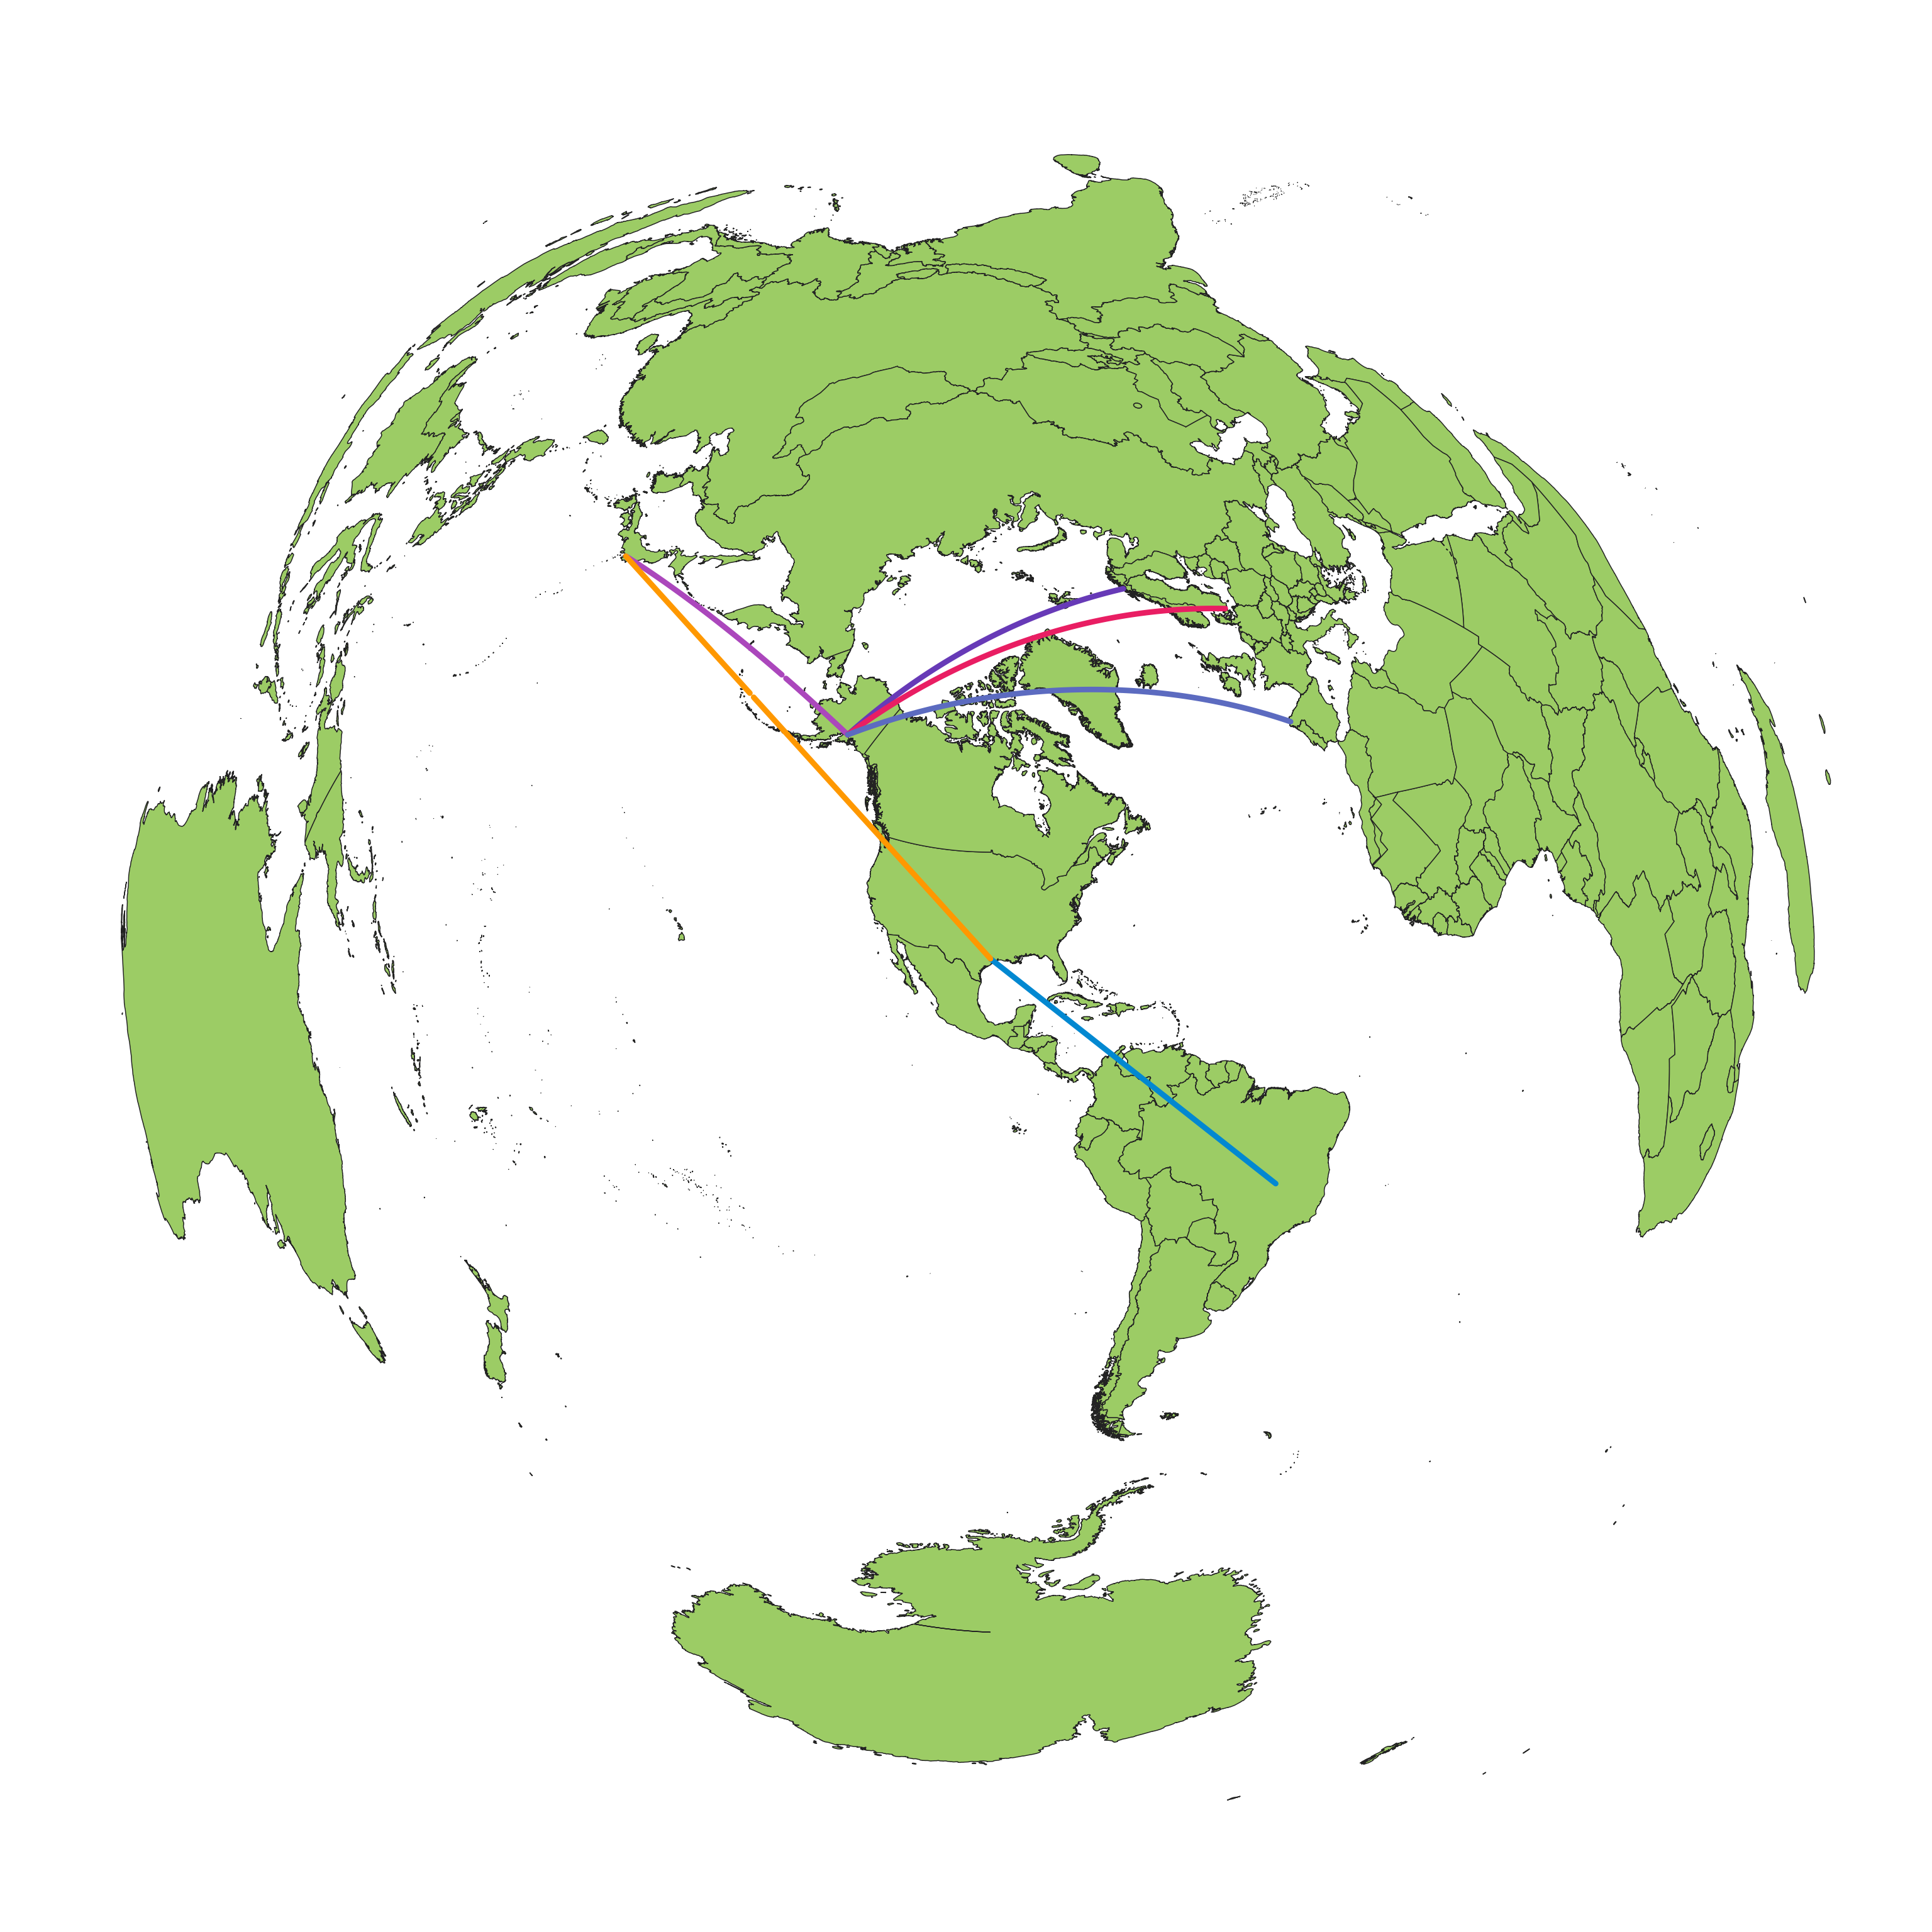
Azimuthal equidistant projection centered on Houston
The AuthaGraph projection properly describes an ozone hole.
So does the azimuthal equal-area projection. Once again, you really shouldn’t use world maps for specific topics like ozone holes as you’d be introducing unnecessary distortions, especially when the central focus of ozone holes is the poles, and thus there’s no need to display the rest of the world. Not to mention that this projection *cannot* display the North Pole in full as it gets stretched out due to its arrangement.
Slide 4: “the World without Ends”
“It is able to tile the AuthaGraphic world map without gaps and overlaps. The way of tessellation has seamless connections between maps as if it is an Escher’s tiling. Same as fishes and birds in his painting, six continents are not fragmented and seven oceans keep their continuous networks. It had been thought the world is on an infinite plane since geometries of a sphere and of an infinite plane are similar. Walking on both surfaces, we do not meet an end. A geographical network in the map is able to expand to any directions on the tessellated maps. Thus the world map reproduces the spherical world without dead end on a plane.”
This is nothing more than a gimmick. There is very little practical reason why you’d want to rearrange these maps in a different way, and it’s clear that they only presented this just to look cool. The image presented even reveals that the example rearrangements don’t make sense, such as how an arrangement splits Brazil in half and the other splits Indonesia in half, with no explanation as to why you’d choose these arrangements over the default one. And even if you really need to rearrange a map projection, it’s possible to do this with GIS and map projection utilities by applying an oblique aspect to the projection you’d want to use, though this is more common with azimuthal maps of larger-scale regions to minimize errors, coupled with the appropriate coordinate systems (WGS84, NAD83, etc. depending on what you’re trying to present).
Slide 5: “World map Re-arrangements”
On the tessellated maps it is able to frame a view field covering a full set of a world. The frame functions as a viewer which enables user to slide and rotate and then to frame a new world map with a preferable region at its center. They provide a new angle of perspective to equally view the world so as to be free from existing perceptions defined by usual phrases such as “far east”, “go up north”, “Western”.
- Map 1: A vision of world from Antarctica. It shows Antarctica’s coastlines face to all three oceans, the Atlantic Ocean, the Pacific Ocean, and the Indian Ocean.
- Map 2: A vision from the North Pole and the 1st meridian. It shows a layout which divides the world into new world below and old world above.
- Map 3: A vision of world from Brazil. It shows geographical relation with Brazil, half globe away from Japan.
- Map 4: A vision of world from South Africa. It shows geographical location of South Africa where an economy development, diamond, and World Cup attracted a public attention.
This slide finally explains the alternate arrangements of the map from slide 4. This explanation seems more like a gimmick than actually being useful. Like, what even is the point of showing the world from the North Pole perspective, or from Brazil? I fail to grasp the point of these rearrangements because the maps they showed don’t really make any practical sense, and in the case of the 4th map, it’s literally just the original layout but with the map centered on the more conventional Atlantic Ocean rather than the Pacific Ocean.
Once again, if you really need to rearrange a map projection, in this case, showing the world map centered on different parts of the world, you could’ve just used an azimuthal projection with an oblique aspect, especially for the first scenario of centering the map on Antarctica. And in the second scenario, something like a transverse Mercator projection should suffice, especially when the use-case is as nonsensical as “dividing the world into the New World below and the Old World above”.
Slide 6: ISS Long-term Tracking
An orange line on tessellation-world composed by 49 maps tracks a journey of International Space Station (ISS) for eight hours. Its coordinates are provided by ‘Cerestrak’, a website distributing ISS’s orbital data. NASA and the US department of defense issue the original data. The coordinates are defined by calculating the data to reflect corrections of the orbit. It has past 140 years since ‘Around the World in Eighty Days’ (Verne) was published. Satellites fly across the world in hours while they play leading roles of telecommunication and remote sensing such as observing weather, environmental pollutions and natural resources. The tessellationworld map [sic] shows such rapid movement of a satellite in one line.
Again, a gimmicky application, and an inappropriate use of this map projection. This image, unlike the previous “flight path” example, actually shows the great circle paths as irregular curves, which makes it unsuitable for this application. Using the Mercator projection that’s tiled horizontally would’ve been *ironically* better than this projection as at least that projection shows great circle paths as sine waves which make more sense.
All in all, none of the slides show a good application of this projection, and the wording really sounds like it’s trying to get you emotionally hooked by showing “real-world” scenarios that could’ve been solved with existing projections, and in other cases, and in other cases, present you with something that looks like it has substance (“you can view what the world looks like from Brazil!”) when in fact it has very little, if any, practical use, and even in those scenarios, existing projections could be used that’s more suitable for that kind of application.
The Good Design Grand Award page: AuthaGraph’s admission to ditching true area equivalence?
What interesting is that Narukawa might have actually considered a truly equal-area projection (presumably something like the van Leeuwen projection), but decided against it because it would introduce too much distortion (which that projection does suffer from due to the nature of equal-area projections), as evidenced by this description on the Good Design Award page:
Map projection has four measures, or four “correct” things: area, shape, direction, and distance. It has been mathematically proven that there is no solution that satisfies all of them, and if the area is correct, the distortion of the shape increases. In the early stages of development, we specialized in area and sought a map with a perfect area. This is because the logic was clear and it was easy to gain the understanding of map experts. On the other hand, we received harsh comments such as “the shape feels strange.” This is my wife. Based on the criticism that “even if the area is correct, if the shape is distorted, women and children will not look at it,” we devised a combination of projection methods that trade off the four distortions, make the area as correct as possible, reduce the distortion of the shape, and draw it on a flat surface in a way that does not look out of place with the way the land and sea look on a globe. The ingenuity is in the combination of the projection methods that make it possible to make a tradeoff between the four distortions, while making the area as correct as possible and reducing the distortion of the shape, and to draw it on a flat surface in a way that does not look out of place with the way the land and sea look on a globe. I would like to convey the ingenuity that went into the problem of not having a perfect solution that satisfies everything, and the ingenuity that went into the solution through trial and error, even though it is modest.
During the production, my wife (representing the general public) commented that “No matter how new a world map you come up with, if it is far removed from previous maps, ordinary people will not look at it.” So we decided on the projection method and projection axis settings to create a world map that fits completely into a rectangle without breaking the layout of the existing map, with Japan in the middle, Russia on the left, and America on the right, and that does not break the land. Ordinary people’s criticism is harsher than that of experts, and sometimes it is on point.
Notice how he admitted that this is a compromise projection by saying “the combination of the projection methods that make it possible to make a tradeoff between the four distortions, while making the area as correct as possible and reducing the distortion of the shape”. That’s basically what a compromise projection is: a jack-of-all-trades projection that neither truly preserves area nor shape.
However, he literally tried to handwave this, by saying:
“A world map projection using a polyhedral projection method. By combining gnomonic and orthographic projections, the area is accurate and the distortion of the shape is reduced. (The accuracy needs to be improved by using the same method to be officially called an equal-area projection)…”
Perhaps this might be the reason why Narukawa is so unwilling to publish his equations, because it would reveal that it is possible to create a truly equal-area tetrahedral projection similar to the van Leeuwen projection published in 2008 by Diederik van Leeuwen and Daniel Strebe, but he decided not to as the initial feedback was fairly negative due to the heavily distorted shapes.
Conclusion: An overhyped, proprietary novelty
Ultimately, the AuthaGraph world map is a fascinating case study not in cartographic innovation, but in the power of slick marketing and emotional appeal. After cutting through the buzzwords and dismantling the misleading claims, it’s clear that the projection offers very little that is genuinely new or uniquely useful. Its supposed solutions to global perspective issues are better handled by a host of existing projections, from azimuthal maps for viewing the poles to the gnomonic projection for plotting great circle routes.
The features touted as revolutionary, such as its ability to tessellate or frame the world from different perspectives, are little more than gimmicks that have limited practical application and can be replicated with standard GIS software. The constant use of the Mercator projection as a strawman, a common tactic for promoting “new” maps, further underscores a strategy focused on public appeal rather than scientific contribution.
However, the most significant issue remains to be the profound lack of transparency. Narukawa’s refusal to publish the projection’s mathematical equations prevents it from being peer-reviewed, verified, or implemented by the cartographic community. As admitted by the creator himself, the final design was a compromise, sacrificing true area equivalence for aesthetics that would be more palatable to the general public. This decision moves AuthaGraph out of the realm of scientific advancement and firmly into the world of proprietary product design.
In the end, AuthaGraph isn’t a groundbreaking tool for science or education, but rather a commercial product sold with a compelling but hollow narrative. It serves as a potent reminder that without transparency and a willingness to engage with the scientific community, even a “Grand Award”-winning design can be little more than a beautifully packaged, mathematically ambiguous curiosity.